More power than paid charts. ₹0.

The most powerful charting terminal — completely FREE.

Trade with the full picture. Track live NSE prices, confirm setups across multiple charts, practise on past sessions with bar replay, and let alerts watch your levels — so you act on time, every time.

No subscription. No paywall. Sign in once and start charting.

Bharat Charts terminal on a trader’s desk — live NIFTY chart, watchlist and option chain
₹0 forever No paid tier for NSE traders
Unlimited indicators Stack every study your setup needs
Multiple grids Compare charts side by side
Dedicated watchlist Your names, always beside the chart
Replay Practise on past sessions, bar by bar
Alerts Get notified the moment price hits your level
Option chain Live OI, IV and premiums, strike by strike
Heatmap Spot the day’s gainers and losers at a glance

Most free charts show you only half the picture.

Other chart apps give you a few tools for free. For the rest, you have to pay. Broker charts are made for buying and selling — not for studying the market.

Half the picture means late entry, late exit.

Other chart apps Broker charts
Other charts · Free plan Limited
  • Only 1 chartCan’t see Nifty and your stock together
  • Few indicatorsPay to add more
  • Late pricesPrice has already moved
  • Basic toolsReplay and alerts cost extra
What you can seeOnly half

Introducing Bharat Charts

A proud charting platform developed by Vardhan Capital

Trader using Bharat Charts — NIFTY chart, watchlist, multiple charts and market overview

One screen for everything: live NSE prices, many charts side by side, all the indicators you want. What other apps charge for, you get at ₹0.

  • Many charts at onceNifty, sector and your stock side by side
  • Unlimited indicatorsAdd as many as you need — no limit
  • Live pricesNSE prices, option chain and heatmap
  • Replay and alertsPractise on old days, get price alerts
Register for Bharat Charts

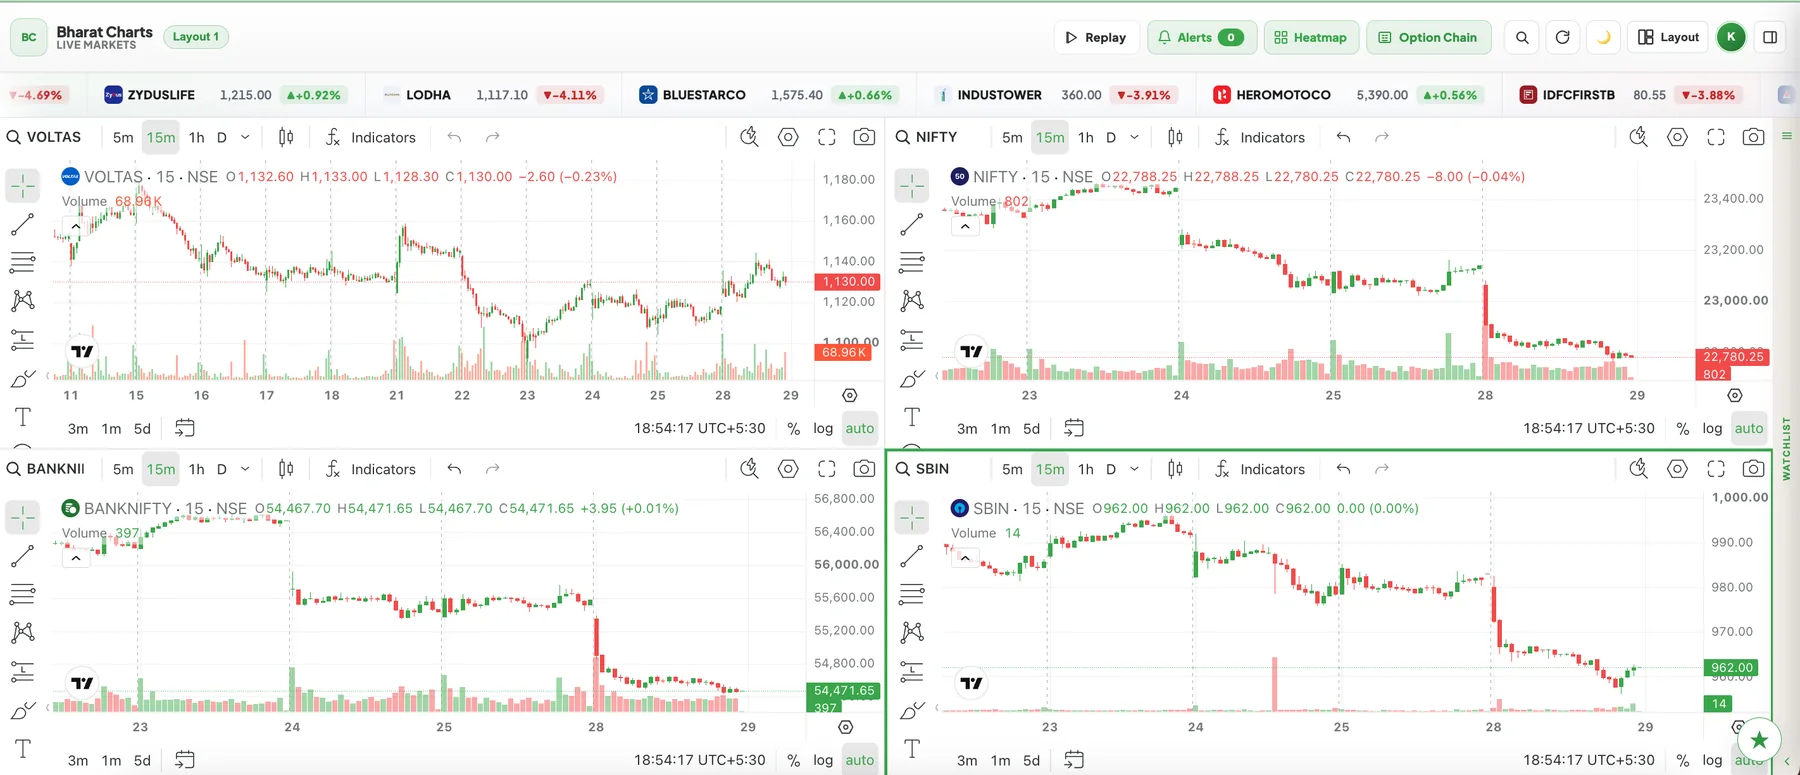
Multiple grids

See many charts on one screen.

Put Nifty, Bank Nifty and your stock side by side. When the index moves, you see your stock move at the same time.

  • Up to 8 charts in one layout
  • Change any chart’s stock in one click
  • Your layout is saved for next time
Multiple grids in Bharat Charts

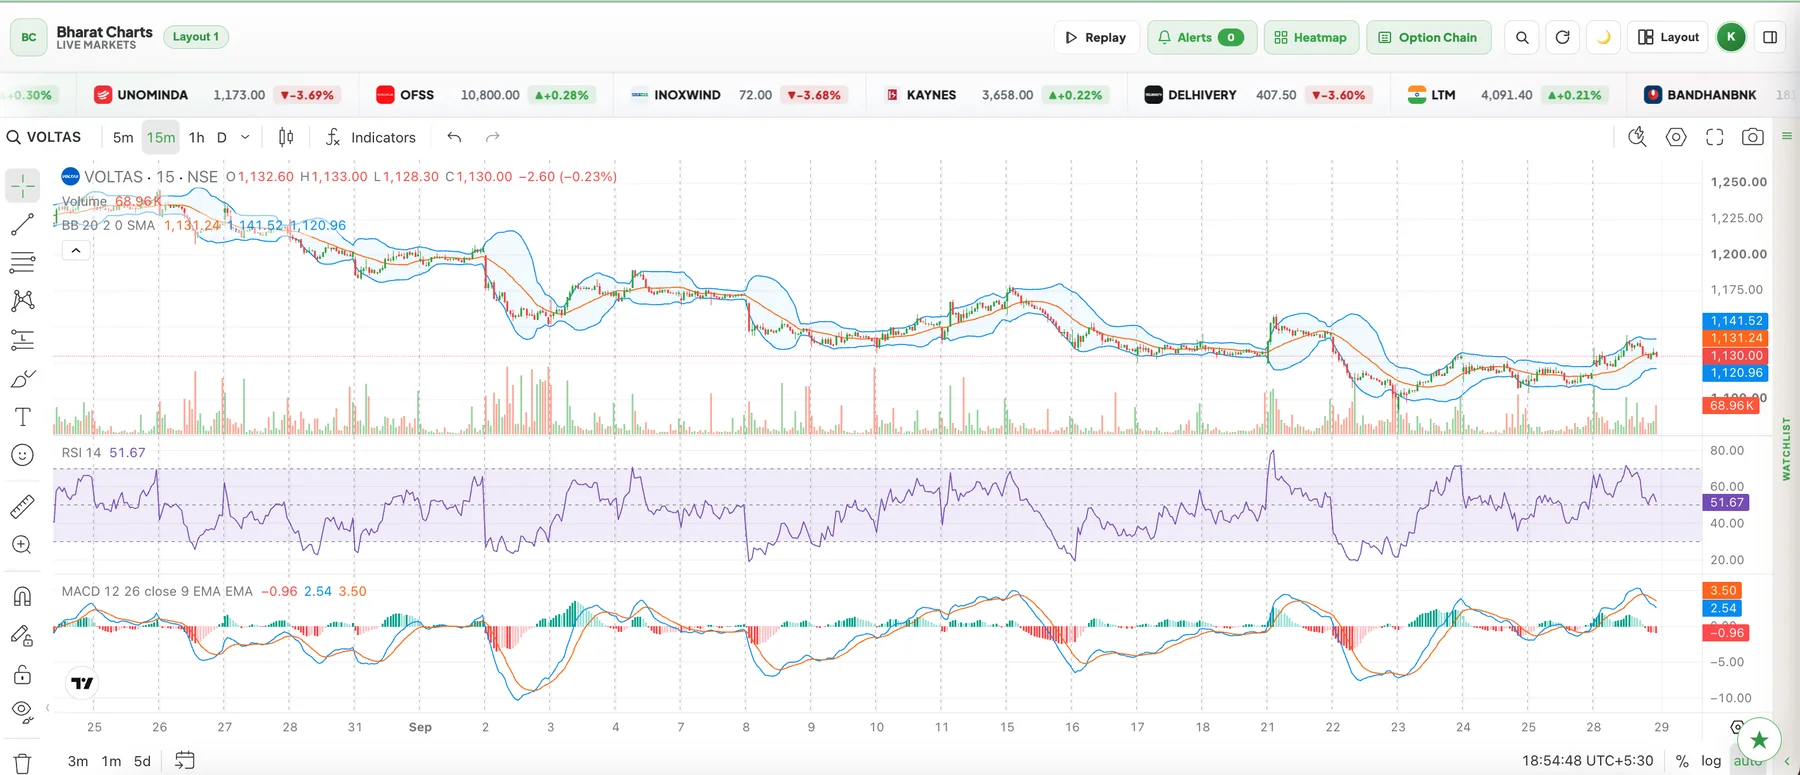
Unlimited indicators

Add every indicator you need. No limit.

RSI, MACD, VWAP, EMA, Bollinger Bands and many more. Other apps stop you at two or three. Here you can add as many as you like.

  • 100+ indicators ready to use
  • Many indicators on one chart
  • No upgrade needed
Unlimited indicators in Bharat Charts

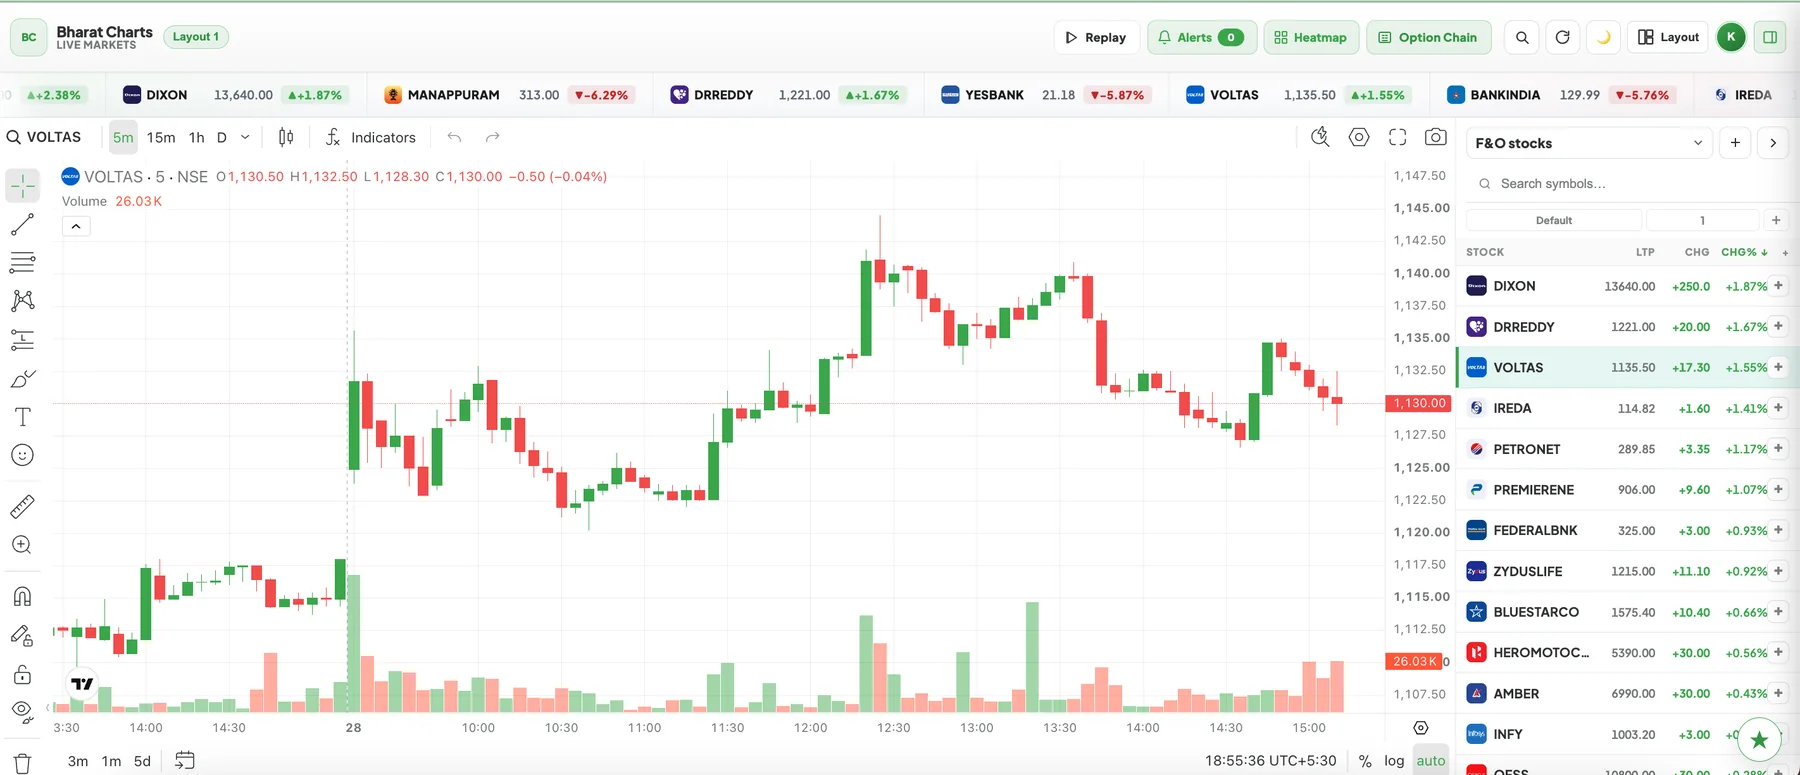
Dedicated watchlist

Your stocks, always next to your chart.

Keep your favourite stocks in your own list with live prices. Click any name and its chart opens.

  • Live price and % change for every stock
  • Ready lists for indices, sectors and F&O
  • Search any NSE stock and add it
Dedicated watchlist in Bharat Charts

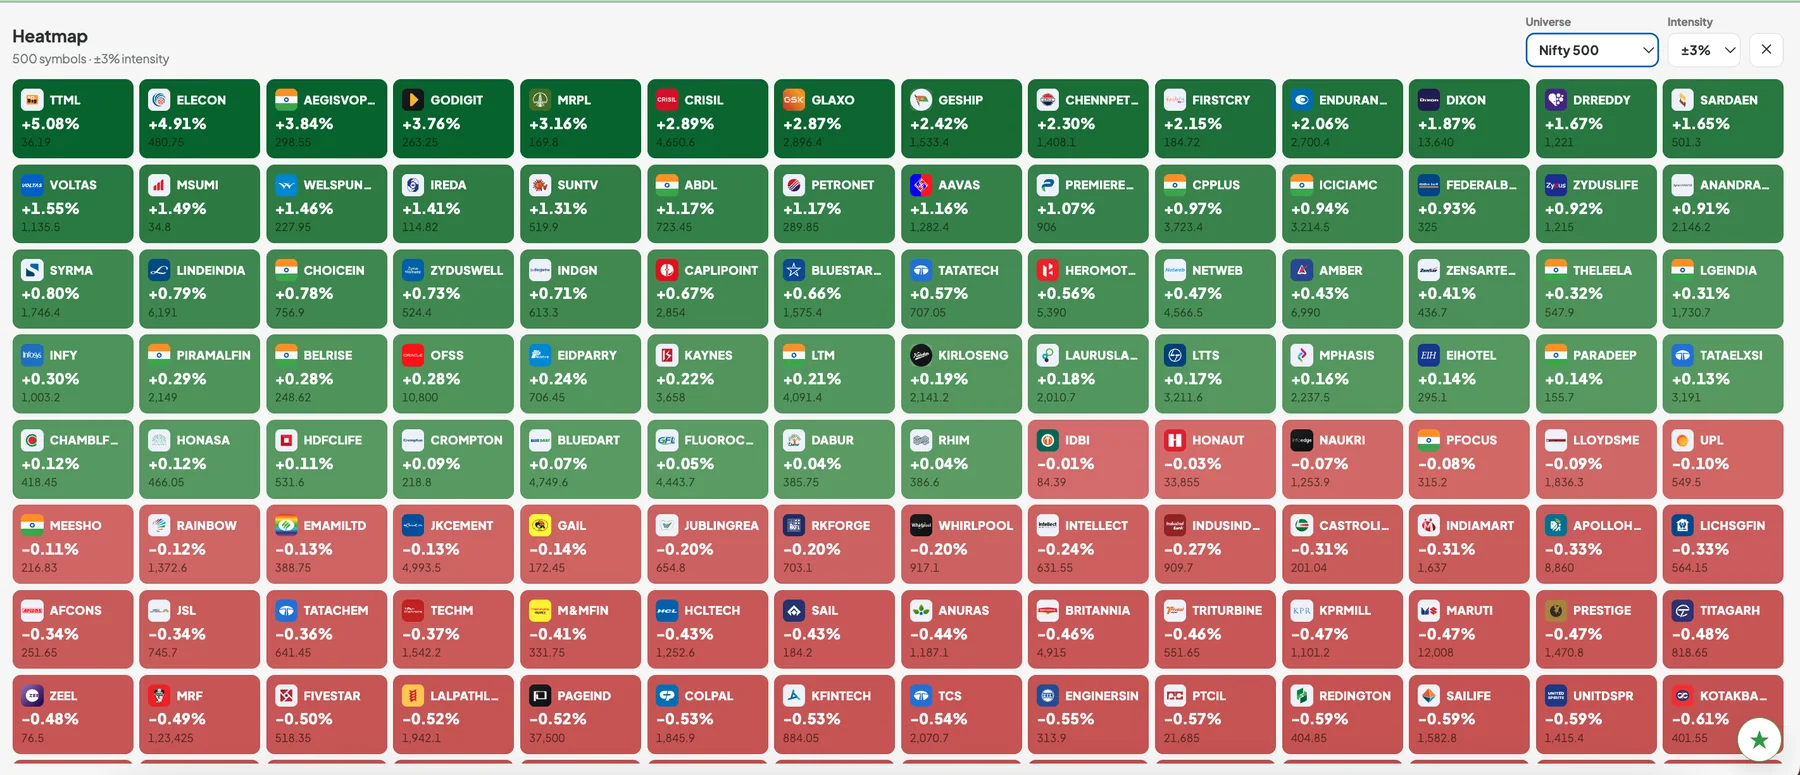
Heatmap

See the whole market in one look.

Every stock is a coloured box — green is up, red is down. Find the day’s top gainers and losers in seconds.

  • Nifty 50, Nifty 500, F&O, commodities and more
  • Bigger moves stand out at once
  • Click any box to open its chart
Heatmap in Bharat Charts

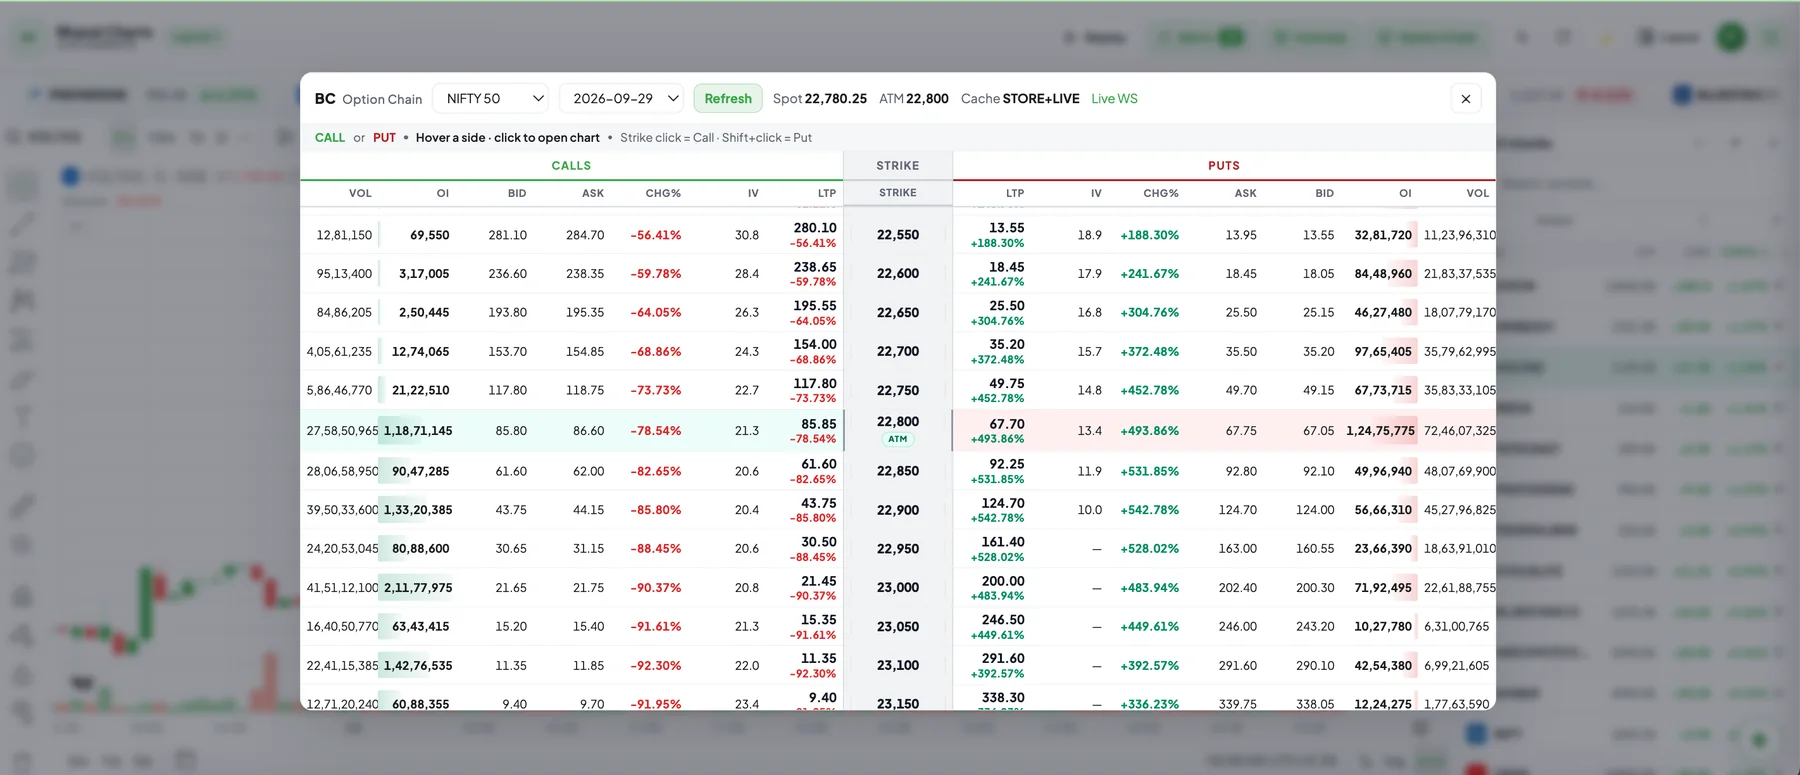
Option chain

Live option chain, strike by strike.

Watch premiums, OI, change in OI and IV update live for NIFTY, BANK NIFTY, FIN NIFTY and SENSEX.

  • Live prices near the ATM strike
  • Open any Call or Put chart in one click
  • Next 5 expiries ready
Option chain in Bharat Charts

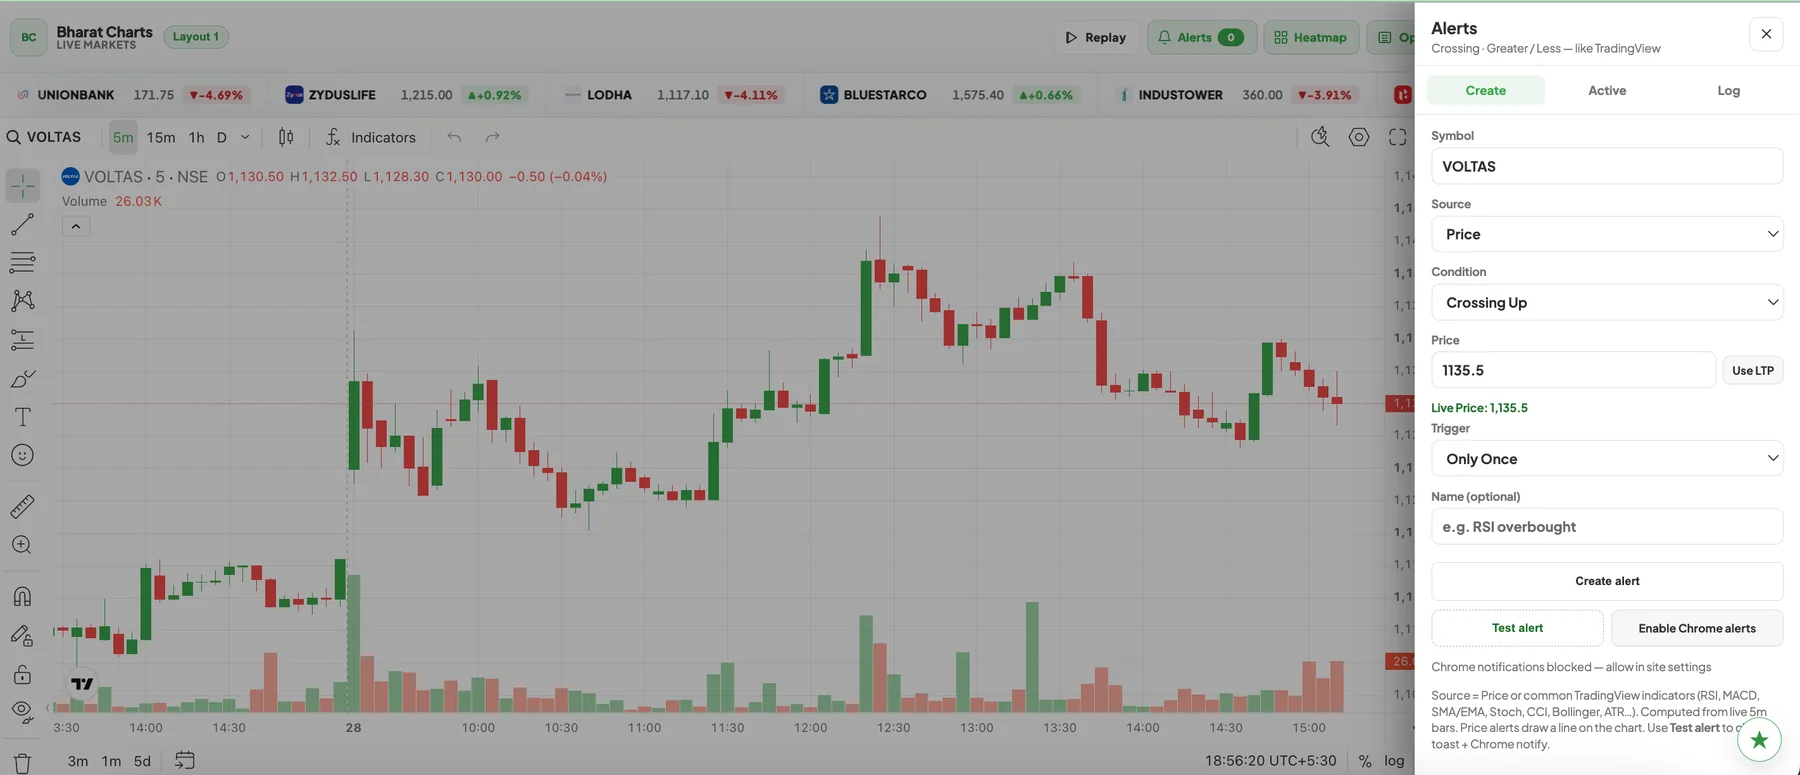
Alerts

Let alerts watch the price for you.

Set your price level once. When the price reaches it, you get a message on screen and in your browser — even when you are in another tab.

  • Set an alert in a few clicks
  • Pop-up and browser notification
  • No need to watch the screen all day
Alerts in Bharat Charts

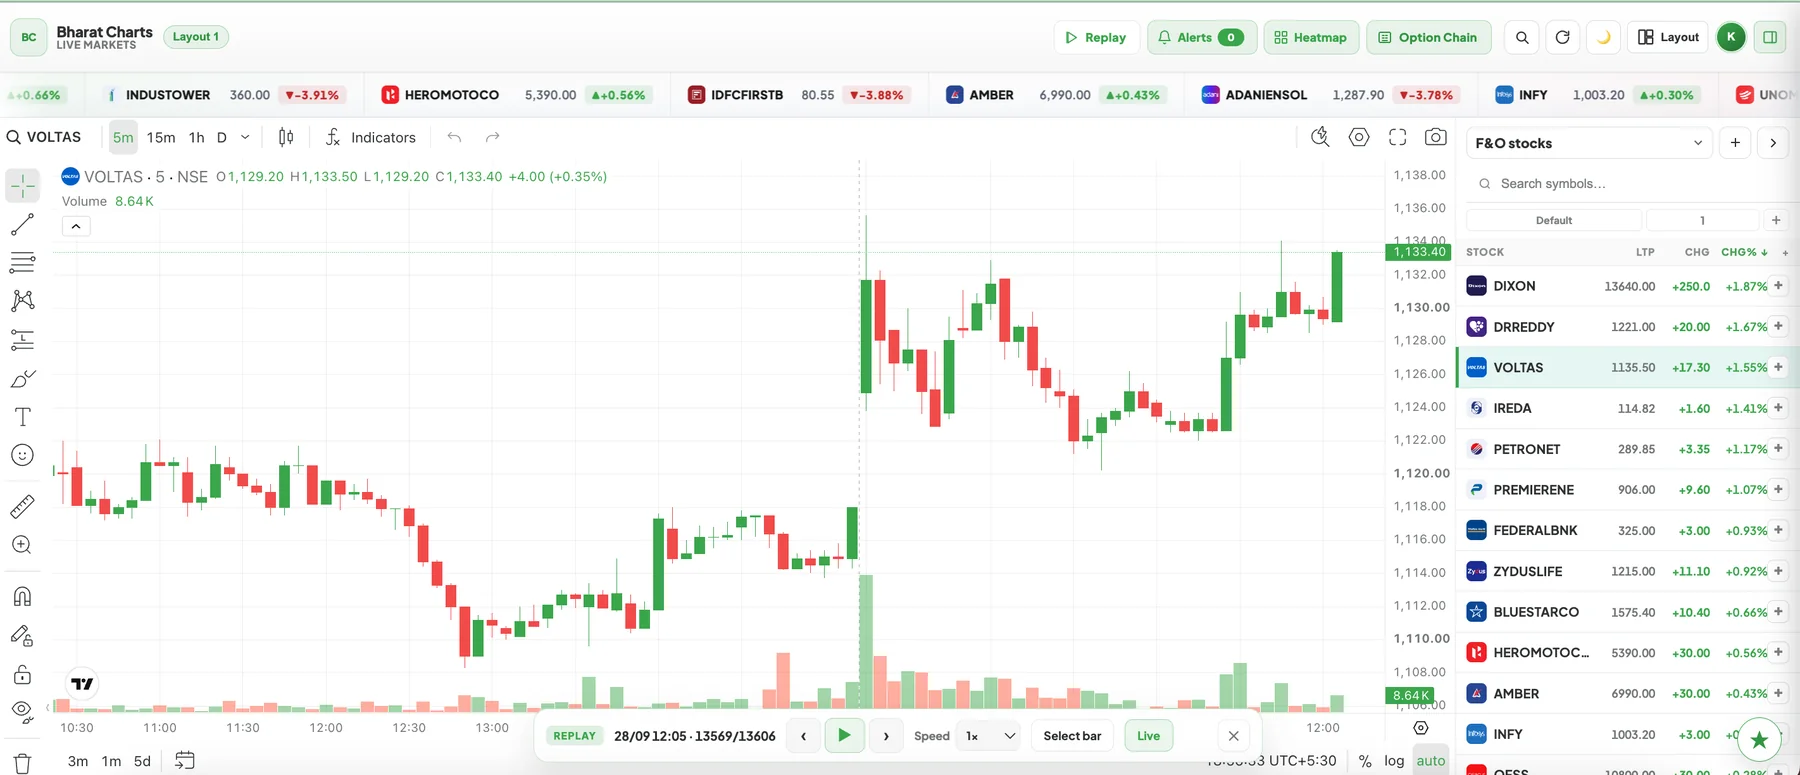
Replay

Practise on past days, candle by candle.

Go back to any old day and play the market again. Test your idea before you put real money in.

  • Replay any past session
  • See how your setup would have worked
  • Learn without any risk
Replay in Bharat Charts

₹0 forever

All of this. ₹0. Forever.

No trial. No hidden plan. No card. Every tool on this page is free for every Indian trader — today and always.

  • No subscription, ever
  • No credit card to sign up
  • Every feature open from day one
Register for Bharat Charts

Loved by traders across India

IT professionals, doctors, traders, investors and beginners — all on one free terminal.

★★★★★ 5.0
“I trade after office hours. Nifty, Bank Nifty and my stocks on one screen saves me so much time. And it is completely free.”
RS Rahul S.IT professional · Bengaluru
★★★★★ 4.5
“I am not a full-time trader. The charts are clean and easy. Alerts tell me when my level comes, so I don’t keep checking the phone.”
PM Dr. Priya M.Doctor · Pune
★★★★★ 5.0
“The option chain is fast and live. I open any strike’s chart in one click. Earlier I was paying for this.”
AK Arjun K.Options trader · Mumbai
★★★★★ 4.5
“Every evening I check the heatmap to see which stocks moved. Very simple to understand, even for me.”
MR Meena R.Long-term investor · Chennai
★★★★★ 5.0
“I started learning this year. Replay helped me practise on old days without losing any money.”
ST Sandeep T.Beginner · Jaipur
★★★★★ 5.0
“Unlimited indicators for free — I could not believe it. My full setup finally fits on one chart.”
FA Farhan A.Swing trader · Hyderabad
★★★★★ 4.5
“The watchlist with live prices right next to the chart is exactly what I wanted. No switching apps.”
KN Kavya N.Chartered accountant · Ahmedabad
★★★★★ 4.0
“Easy to start — just sign in with Google. My son set it up in two minutes and now I use it daily.”
VP Vikram P.Retired bank officer · Lucknow
★★★★★ 5.0
“Most apps want money after two indicators. Here everything is open. Perfect for students like me.”
AD Ananya D.College student · Kolkata
★★★★★ 4.5
“I keep 4 charts open while I work. Prices move live, and it never feels slow.”
HS Harpreet S.Business owner · Ludhiana
★★★★★ 4.0
“Clean candles, live prices and many layouts. For a free tool, this is really good.”
SV Suresh V.Intraday trader · Coimbatore

Sample reviews for illustration.

Questions? We have answers.

Everything you need to know before you start.

What is Bharat Charts?

Bharat Charts is a free charting platform for Indian traders and investors, developed by Vardhan Capital. You get live prices, many charts on one screen, indicators, option chain, heatmap, alerts and replay — all in your web browser.

Is Bharat Charts really free?

Yes. It is ₹0, forever. No trial, no hidden plan and no credit card. Sign in with Google and start using every feature.

What features do I get?

Multiple grids (up to 8 charts on one screen), unlimited indicators, your own watchlist, heatmap, live option chain, price alerts and bar replay.

How many indicators can I use?

As many as you want. There are 100+ indicators ready to use, and there is no limit on how many you add to a chart.

Are the prices live?

Yes. Prices and candles update live during market hours, so you see the market as it moves.

Which markets can I see?

NSE stocks, indices and sectors, F&O, option chains for NIFTY, BANK NIFTY, FIN NIFTY and SENSEX, and MCX commodities.

Do I need to install anything?

No. Bharat Charts runs in your web browser. Just sign in with Google and your terminal is ready.

Is this investment advice?

No. Bharat Charts is for education and information only. Always do your own research before you trade.

Talk to the Bharat Charts team.

Have a question, an idea for a new feature, or found something not working? Send us a message — we read every one.

  • QuestionsAbout charts, data or your account
  • Feature ideasTell us what you want to see next
  • Report a problemSomething not loading? Let us know

Free forever · No card needed

Your next trade deserves the full picture.

Live NSE prices, many charts on one screen and every indicator you need — all free. Start in under a minute.

  • Sign in with Google
  • No credit card
  • Works in your browser